Raw indicator overload
Trading platforms often overwhelm users with raw indicators, dense charts, and fragmented context.
Desktop Product Design · Market Intelligence
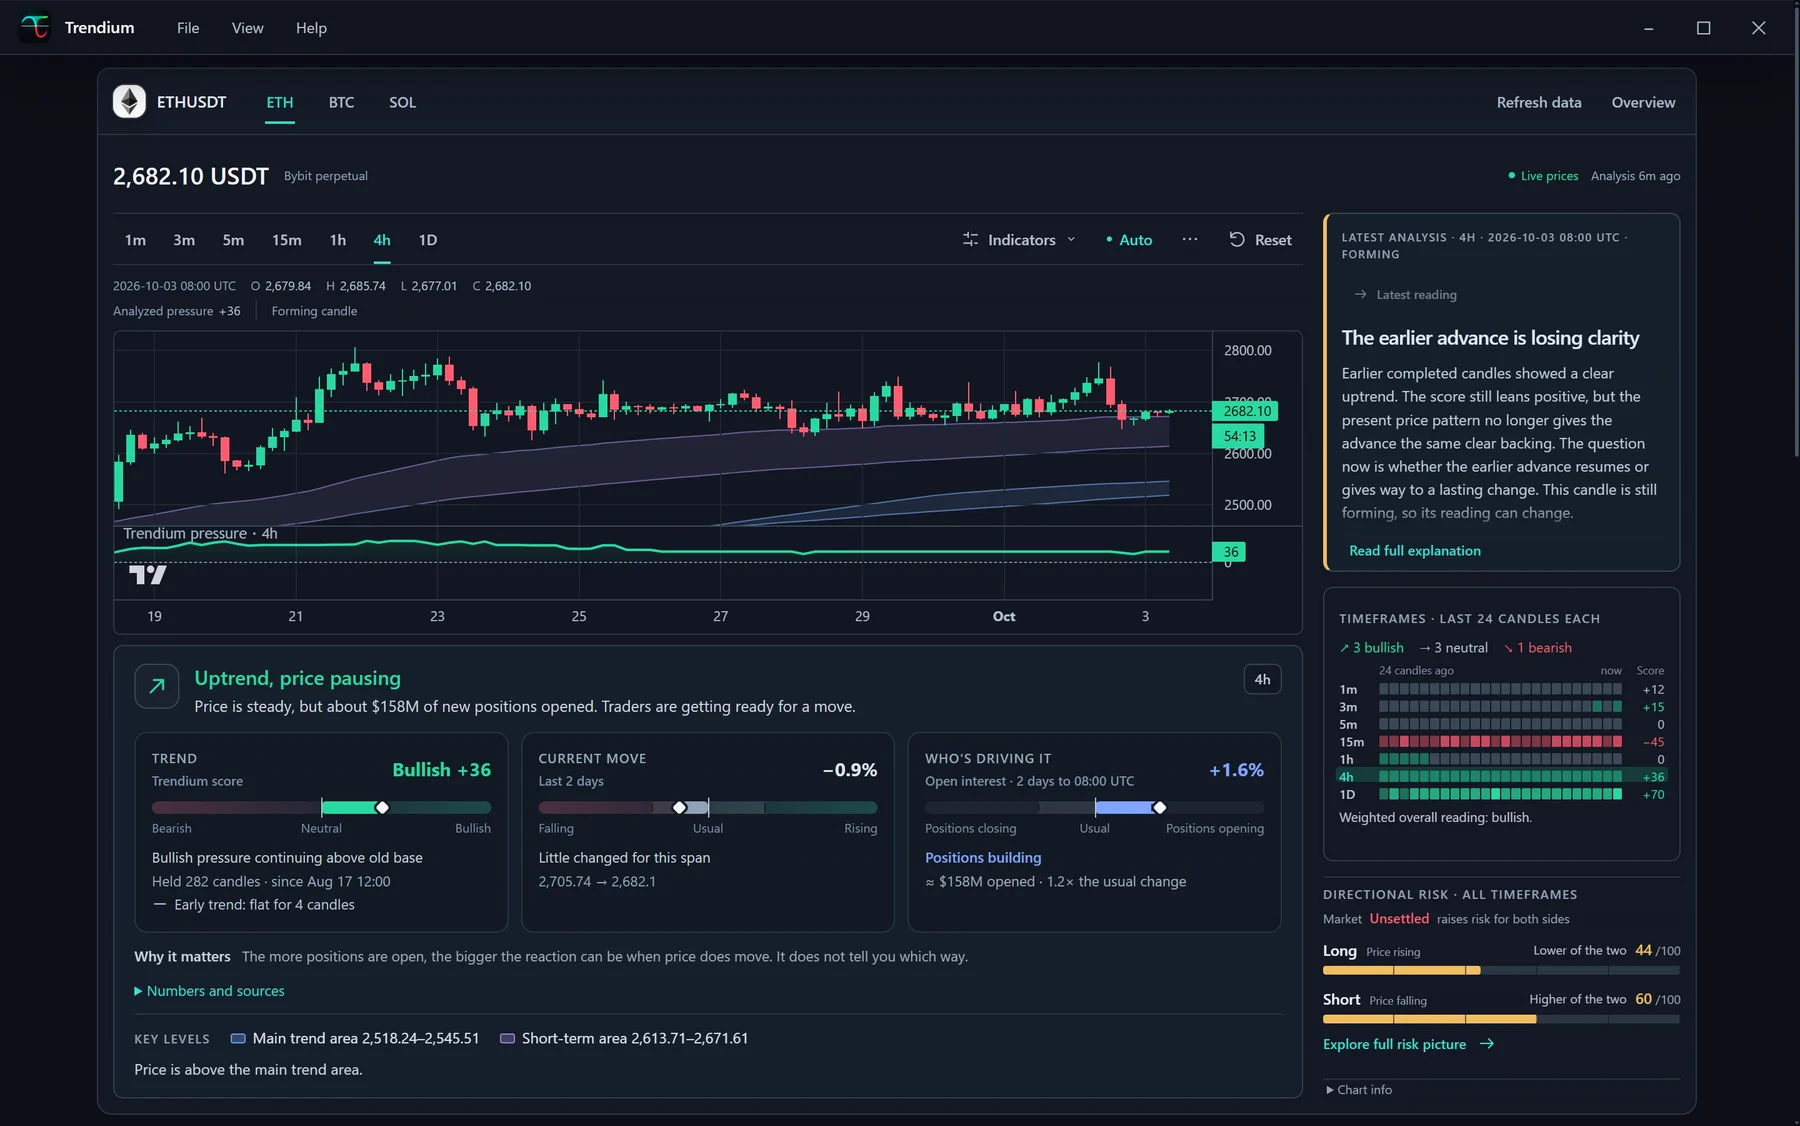
A released Windows Electron desktop app for crypto trend awareness. Trendium fetches public market candle data, calculates indicators and scoring locally, and presents multi-timeframe trend pressure, market phase, timeframe agreement, and directional risk.
Overview
Trendium is for crypto traders and learners who want a clearer way to understand market structure without manually interpreting every timeframe and indicator. It turns candles, timeframe behavior, trend pressure, and risk context into structured dashboards, graphs, score states, and plain-English explanations.
The product is intentionally framed as educational market awareness, not financial advice, prediction, trade execution, or a signal system.
The Problem
Trading platforms often overwhelm users with raw indicators, dense charts, and fragmented context.
Users frequently switch between separate tools and timeframes to understand the broader market structure.
Learners can struggle to understand indicators in context, especially during transitions, compression, and conflicting timeframes.
The interface needed to stay informative while avoiding direct buy/sell signals, predictions, guaranteed outcomes, or profit framing.
Large amounts of live and historical market data had to remain visually manageable and stable enough to review.
My Role
I directed the product concept, positioning, visual direction, UX hierarchy, terminology, and release-readiness decisions.
Product Scope
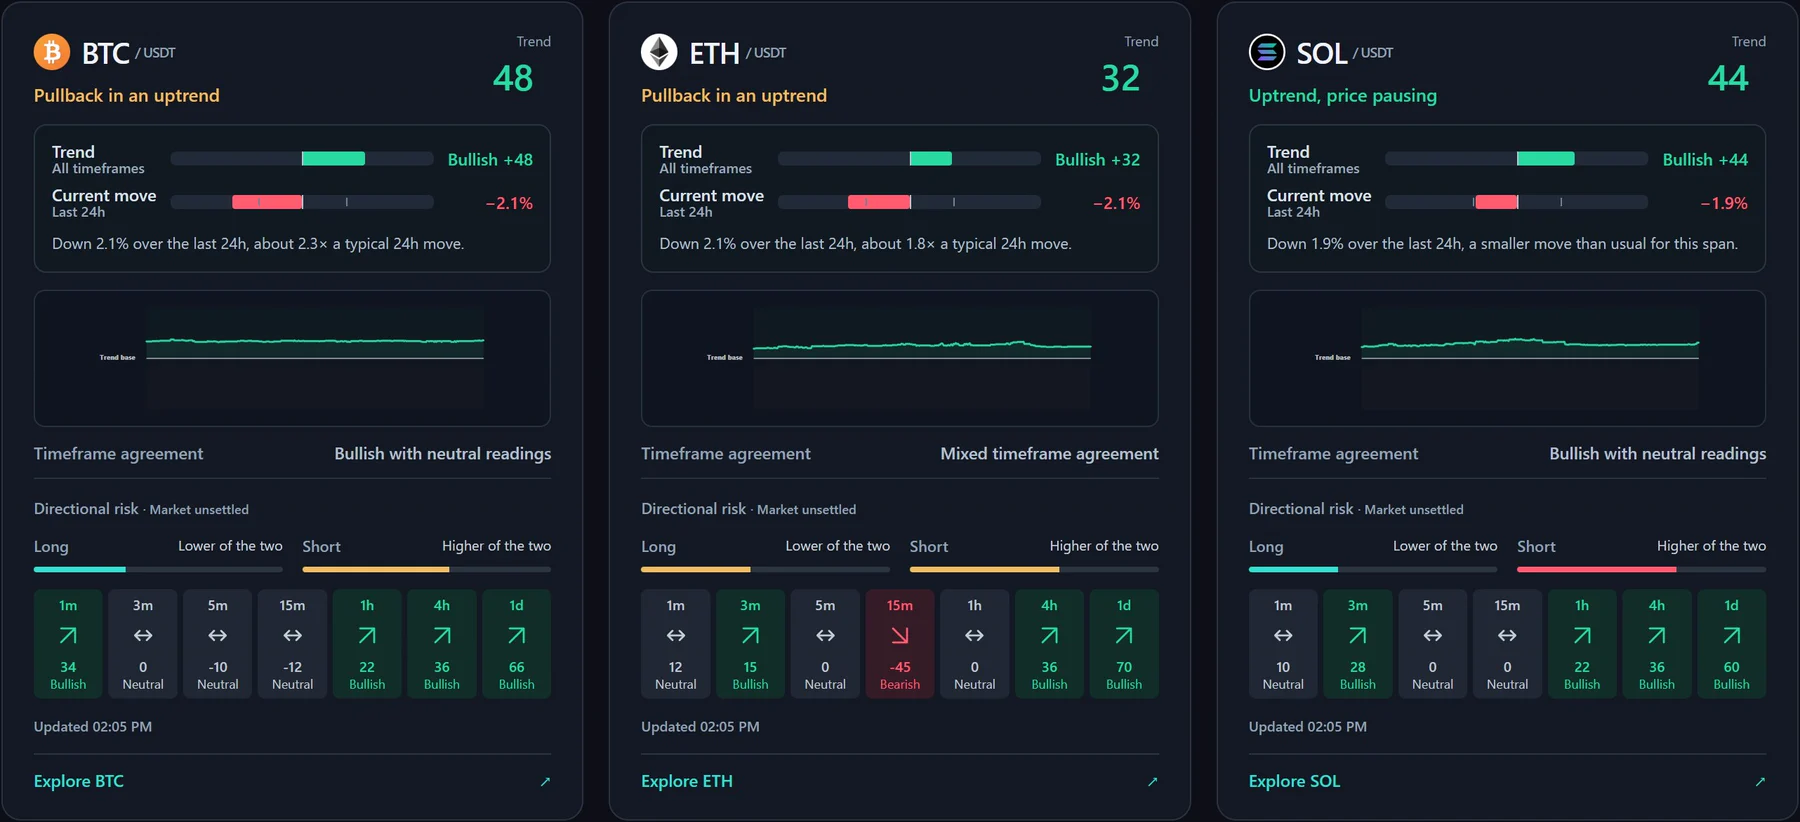
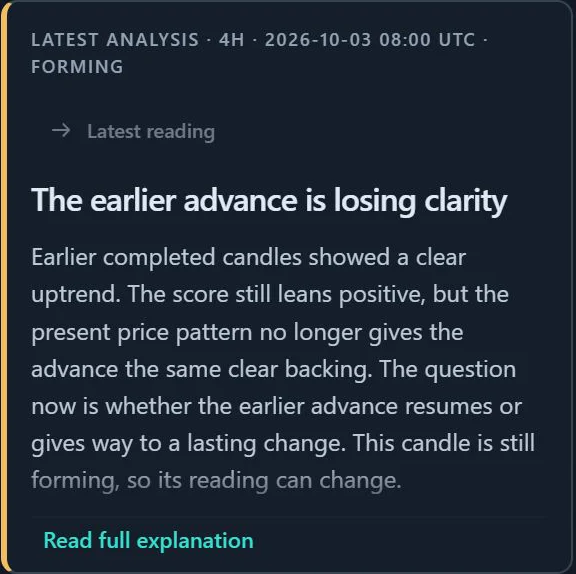
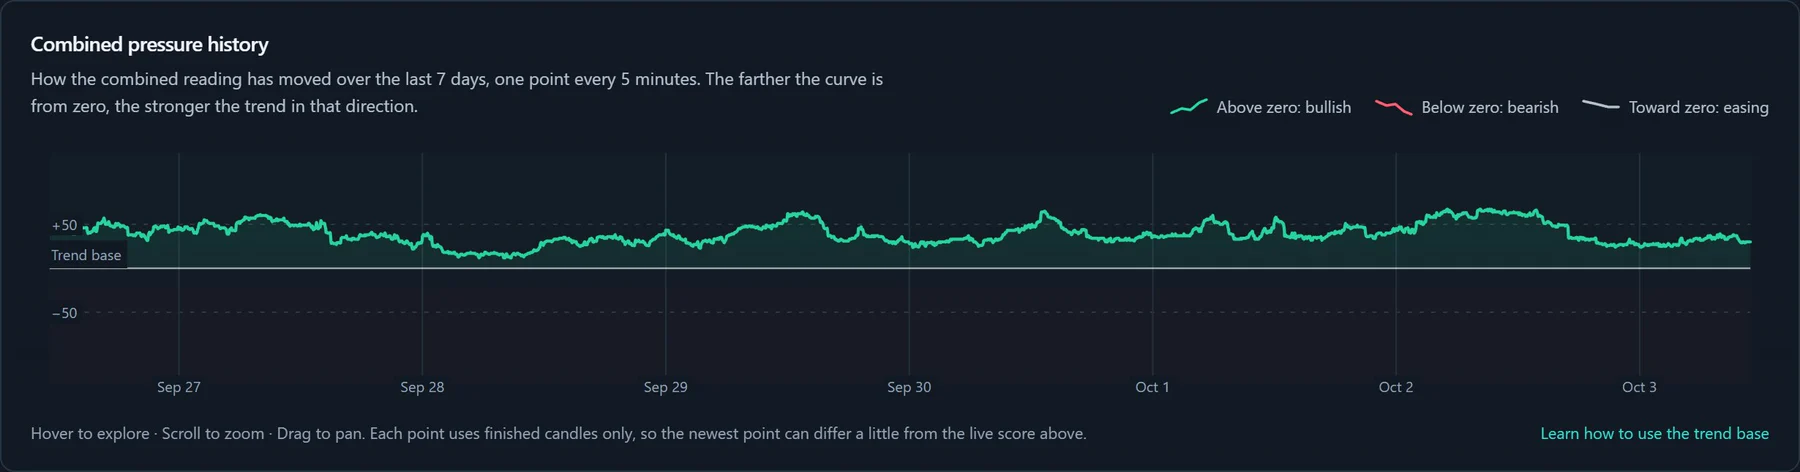
A BTC, ETH and SOL overview, a market page for each coin with a live candlestick chart, a plain-English analysis panel, timeframe and directional risk panels, combined pressure history, a market guide, and help/about/contact/disclaimer/license modals.
Compare BTC, ETH, and SOL; switch coins and timeframes on the market page; read the latest analysis; check trend, current move and open interest; compare timeframe agreement; inspect directional risk; review seven days of pressure history.
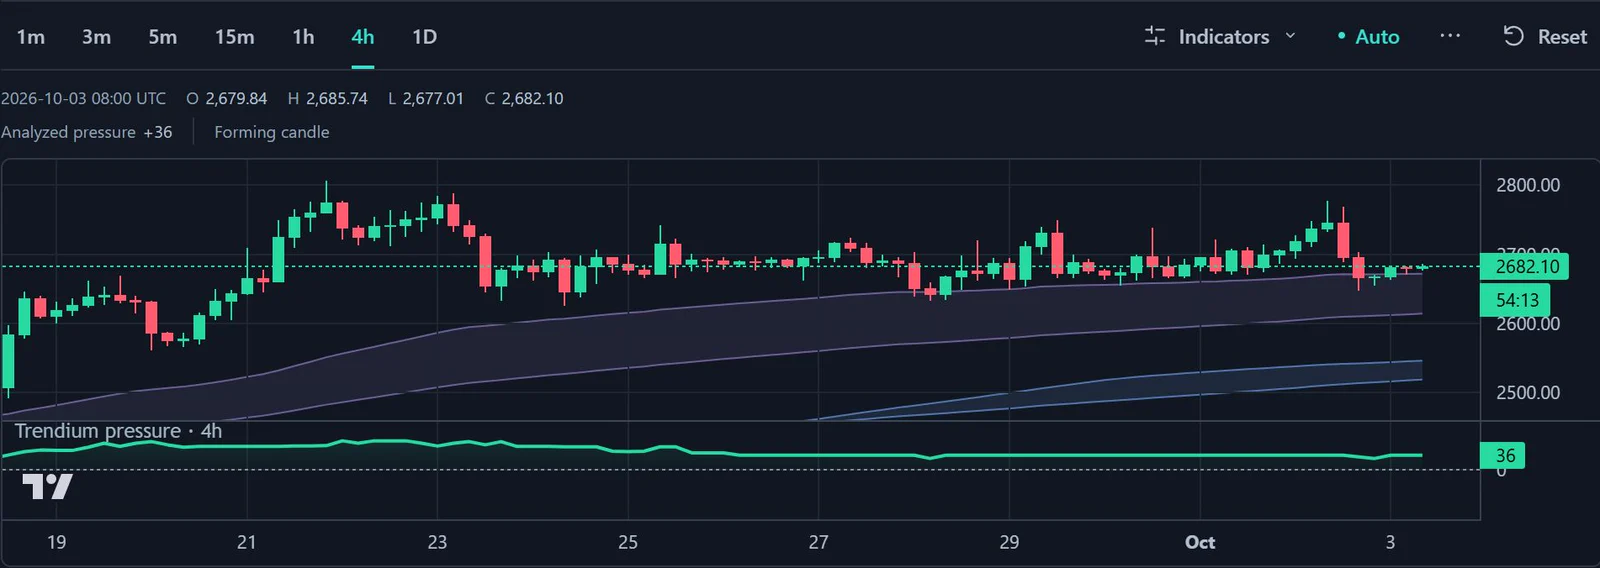
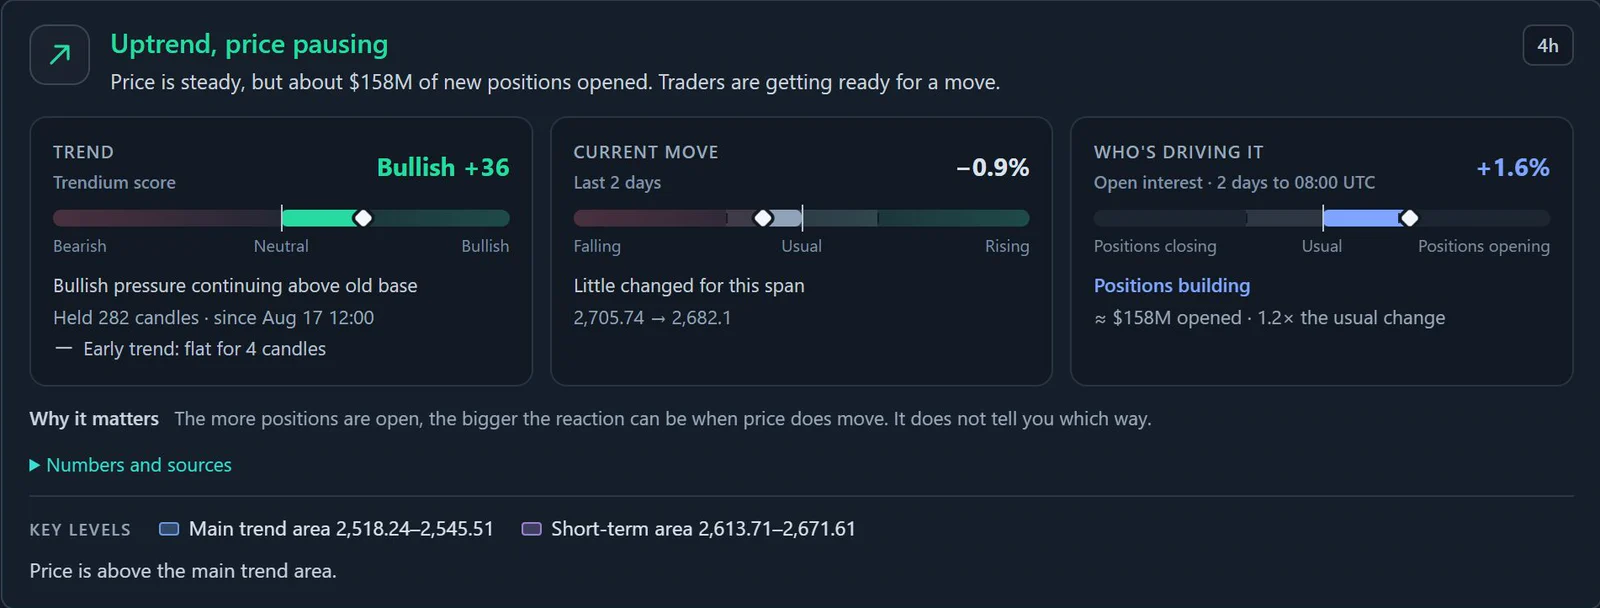
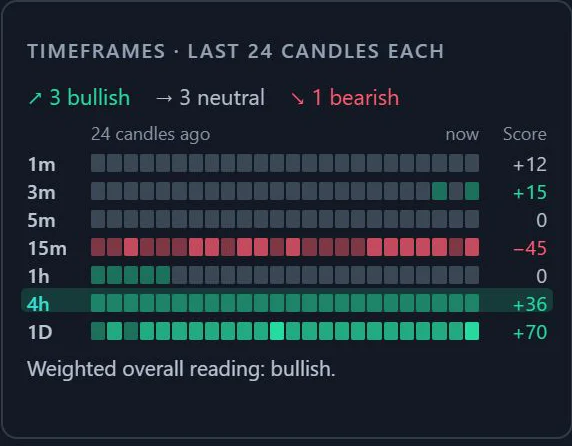
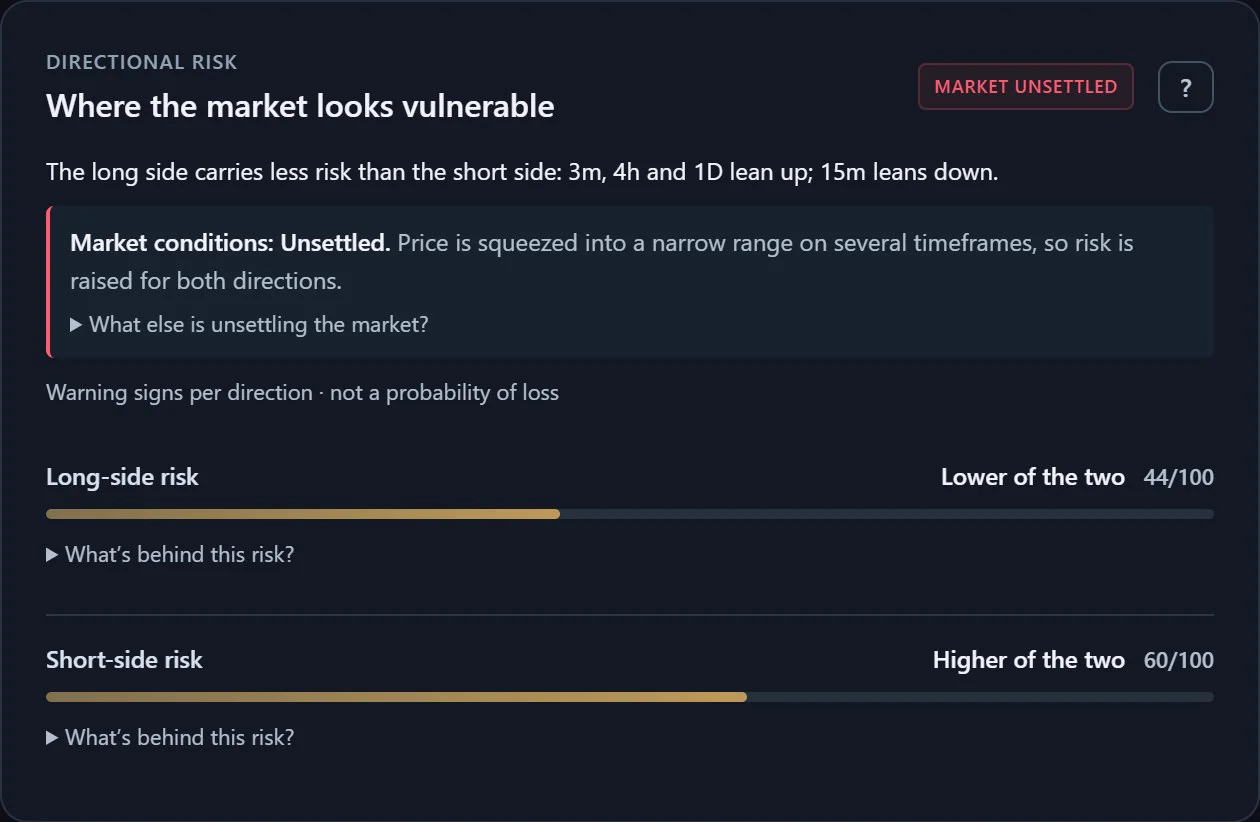
Overview coin cards, a candlestick chart with trend areas and a pressure line, reading cards with Bearish–Neutral–Bullish scales, a 24-candle timeframe grid, long/short risk bars, key levels, and expandable “numbers and sources” details.
Multi-timeframe trend pressure, candle-by-candle score history, closed vs live candle awareness, timeframe agreement, market phase, and long/short directional risk structure.
Core User Journey
Key Design Decisions
Multiple indicators are translated into beginner-safe labels such as market phase, pressure weakening, recovery attempt, compression, transition, and higher timeframe conflict.
A -100 to +100 pressure score gives users a quick visual sense of directional pressure while preserving more detailed graph and timeframe context.
Directional risk bars separate market direction from risk awareness so trend pressure does not imply a trade recommendation.
Higher, middle, and lower timeframe grouping keeps the interface scannable while still supporting deeper review.
The app avoids words like buy, sell, signal, prediction, guaranteed, win rate, and profit. It uses market-awareness terminology instead.
Closed historical graph points are cached during the app session to reduce visual shifting while live candles remain clearly marked as changeable.
Interface Showcase
Iteration
The latest redesign moved Trendium from a dashboard of score bubbles to a full market page. Each coin now gets a live candlestick chart with trend areas and a pressure line, a written analysis of what the latest candles mean, reading cards that answer “what is the trend, how far has price moved, and who is driving it”, a 24-candle view of every timeframe, and a clearer long/short risk panel. The overview was rebuilt the same way, so BTC, ETH and SOL can be compared at a glance.

Constraints
Outcome
External Links
Let’s talk about your next project
Tell me what you’re building.
We’ll find the right starting point together.